asian paint is this a double top ?
Asian Paints - India’s largest and Asia’s second largest paint company, with a turnover of Rs. 155.34 billion, operating in 19 countries and have 26 paint manufacturing facilities in the world, servicing consumers in over 65 countries.
The company is a investor's paradise and also for the traders as it's stock has never shown any downtrend since long. The stock, againt all odds, have stood firm in the market and never let the investors felt down. The stock I am observing since 2009 and is in continuous uptrend. For some time it get consolidated but never entered in the down trend or reversal. We have always recommended to buy the stock on every opportunity.
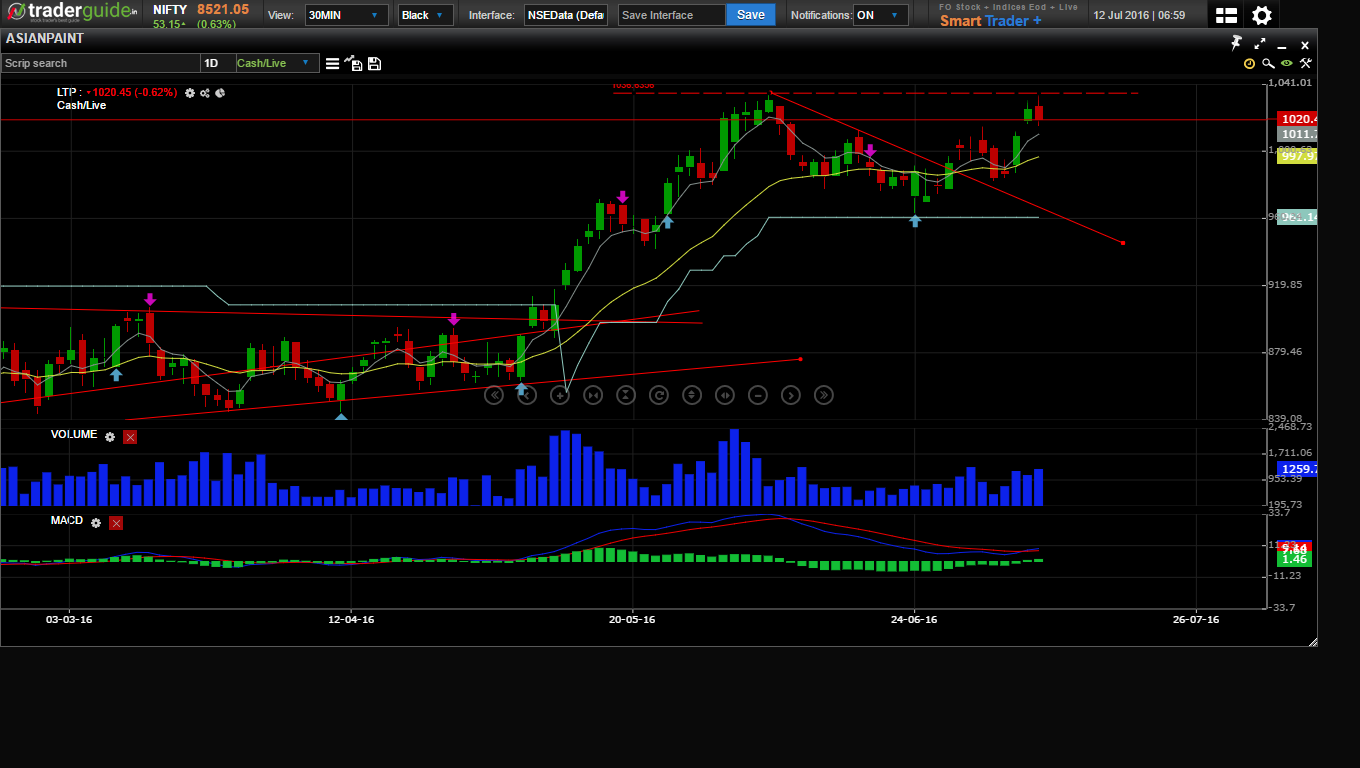
Now, what is so special and why I am discussing the stock today? The stock is extermely bullish and as the market. I have seen Nifty reversal since the date of budget. The stock hit the low of 841.6 on that day. After budget the nifty rallied till today but the stock didn't. Asian Paint hit the high of 1037.45 on 7th June 2016 and then entered in consolidation and a bit of retracement too was observed on the daily charts. It hit the low of 963.6 on 24th June 2016. It was the BREXIT day.
Since then it again ralied and again hit the high of 1037.90 today in Intraday. I watched in the live market and also witnessed the rates reducing for the counter in Intraday. I immediately take notice and put the counter on the watch. The stock has created an important bearish piercing on the daily charts at the end of the day. Though I personally do not rely too much on this candlestick pattern, I have to take notice of this because of previous high of 1037.45 of 7th June. This is the alarm.
If we consider the situation, it is a bearish piercing and that is also with a possibility of double top. Now, what should be done in this stock? What should be the strategy for tomorrow in the counter? and Should I short the stock or buy Put Option or sell Call Option?
The answer lies in tomorrow's trading session. There can be multiple situations. Quite obvious.
The opening price will play the important role. After opening if the stock start journey towards downside breaking today's low, then the stock will definitely go down and traders can trade in short trade or buying puts or alternatively selling calls. But if the stock not trading today's low or close and remaining above today's low or close, trader should wait for either side breakout.
If the stock, by chance, break today's high and stay above today's high, trader should wait for closing of the day and wait further for the stock to be stayed above the level of 1037 - today's high.
If the stock going down side then sell call will be executed. Sell below 1016, The Target1 will be 991, breaking this the stock may further go down to 975(Target 2).
Tomrrow, just watch the stock for take the direction...and then enter the trade if situation allows...
Happy Trading...Trend is Friend...
Tushar Dave


Client's Spotlight

- Anand Singh Gaur
Readmore

- Sunil Kothari
Readmore
Technical Indicators
Our Partners


